1. Introduction to Forex & Trading
Welcome to the Free Essentials Course! This module will introduce you to the exciting world of Forex (Foreign Exchange) trading. Forex is the global decentralized or over-the-counter (OTC) market for the trading of currencies. It is the largest and most liquid financial market in the world.
Understanding the basics is crucial before diving deeper into any trading strategy, including those used by Expert Advisors like UnifiedEA. Here, you will learn what Forex trading involves, why it's popular, and the fundamental terminology you'll encounter.
What is Forex Trading?
Forex trading involves exchanging one currency for another with the aim of profiting from fluctuations in their exchange rates. For example, if you believe the Euro will strengthen against the US Dollar, you might buy EUR/USD. If your prediction is correct, you sell it later at a higher price.
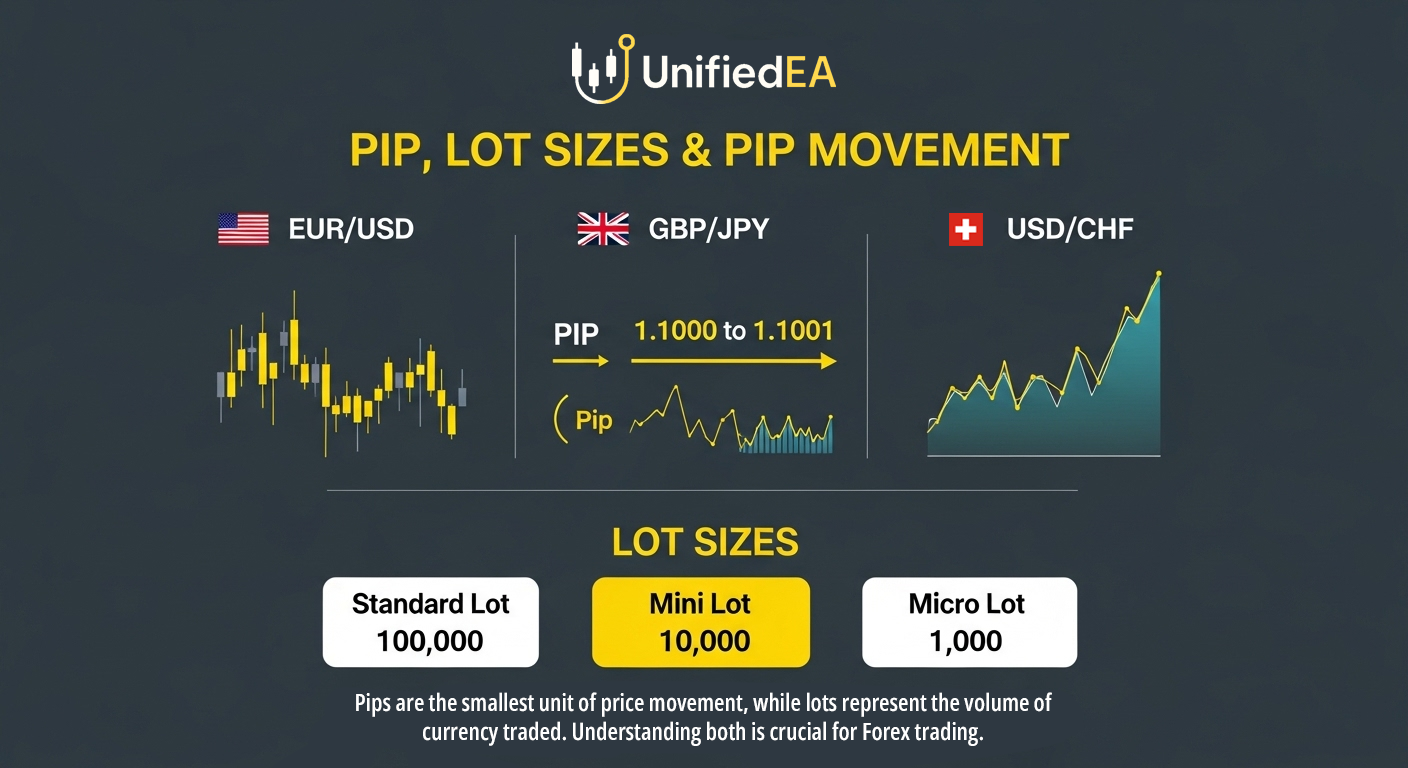
- Currency Pairs: Currencies are always traded in pairs (e.g., EUR/USD, GBP/JPY). The first currency is the "base currency," and the second is the "quote currency."
- Pips: A "pip" (percentage in point) is the smallest price increment for a currency pair, signifying a tiny change in its value. It's how traders measure profit or loss.
- Lots: Trades are executed in "lots," which represent a specific number of currency units. Standard lots (100,000 units), mini lots (10,000 units), and micro lots (1,000 units) are common.
Forex trading can be highly profitable, but it also carries significant risk. It's essential to approach it with proper knowledge, a disciplined strategy, and robust risk management. This course will lay the groundwork for that understanding.
Forex trading attracts millions of participants due to several key factors:
- High Liquidity: It's the world's largest market, meaning you can easily enter and exit trades.
- 24/5 Market: Trading happens almost continuously from Sunday evening to Friday evening (server time), offering flexibility.
- Leverage: Brokers offer leverage, allowing traders to control large positions with a relatively small amount of capital (though this also amplifies risk).
- Low Transaction Costs: Spreads (the difference between buy and sell price) are generally very low compared to other markets.
These advantages make Forex accessible and appealing, but always remember the inherent risks.
2. Understanding Candlesticks & Charts
Trading decisions in Forex are primarily made by analyzing price charts. Candlestick charts are the most popular type of chart among traders because they provide a rich visual representation of price action over specific timeframes. This module will teach you how to read candlestick patterns and interpret chart movements.
Anatomy of a Candlestick
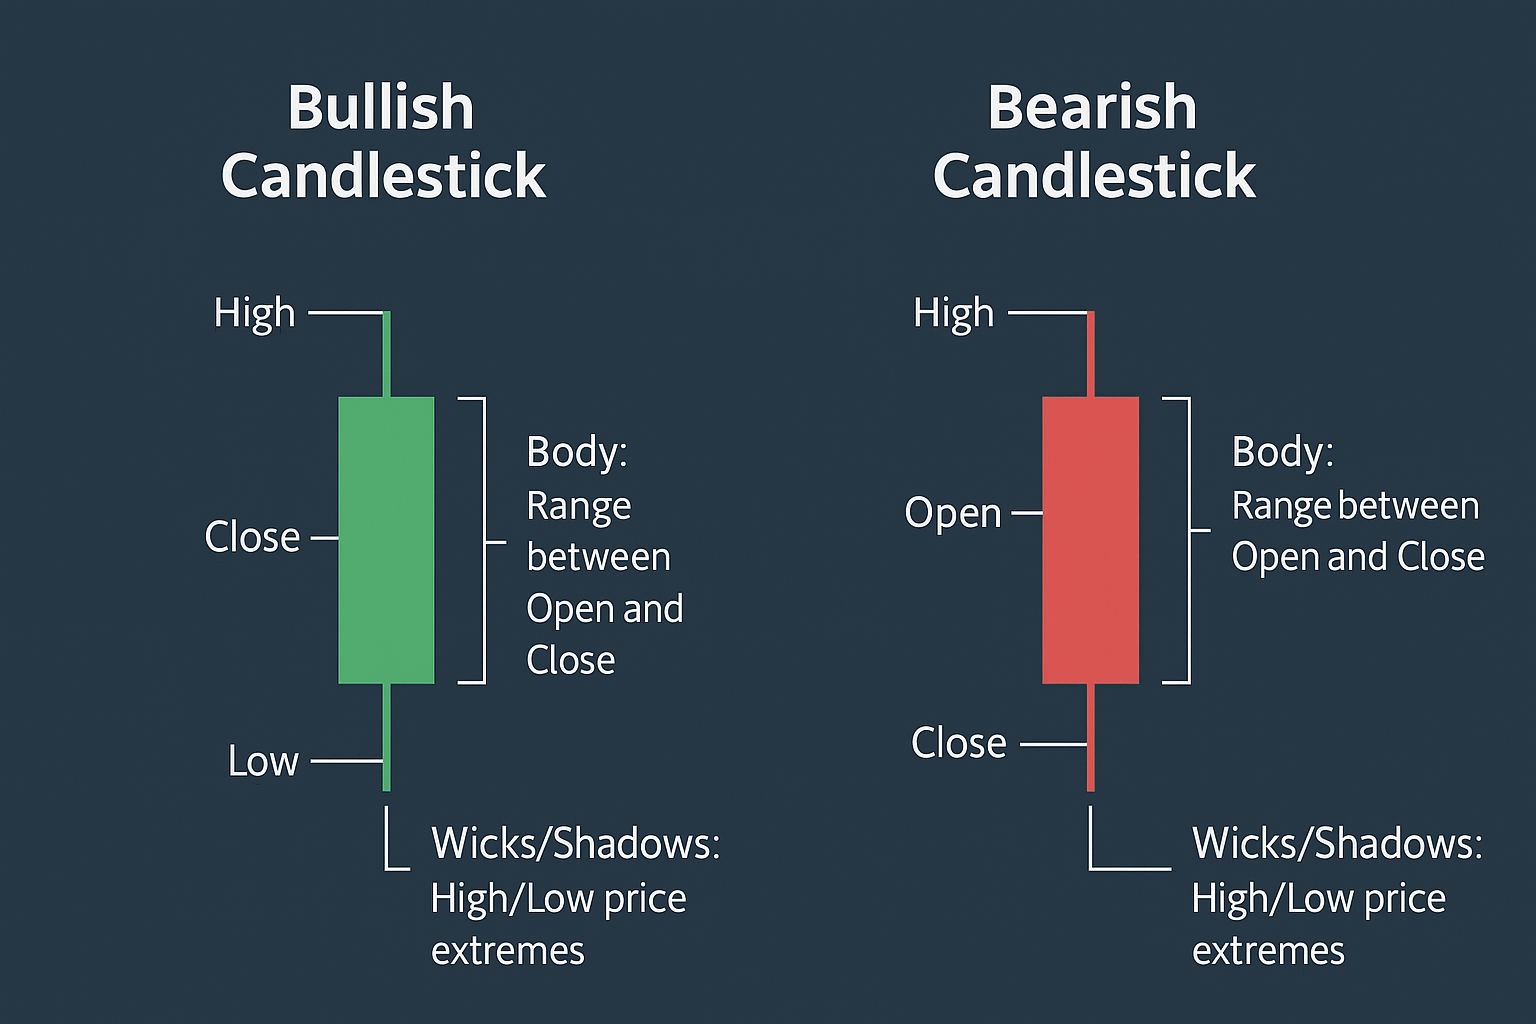
Each candlestick represents price movement within a given timeframe (e.g., 5 minutes, 1 hour, 1 day). A single candlestick tells you four key pieces of information:
- Open Price: The price at which the currency pair first traded during the timeframe.
- Close Price: The price at which the currency pair last traded during the timeframe.
- High Price: The highest price reached during the timeframe.
- Low Price: The lowest price reached during the timeframe.
Candlesticks have a "body" and "wicks" (or "shadows"). The body represents the range between the open and close price, and the wicks show the high and low prices.
Basic Candlestick Patterns
While there are many complex candlestick patterns, understanding a few basic ones can give you immediate insights into market sentiment:
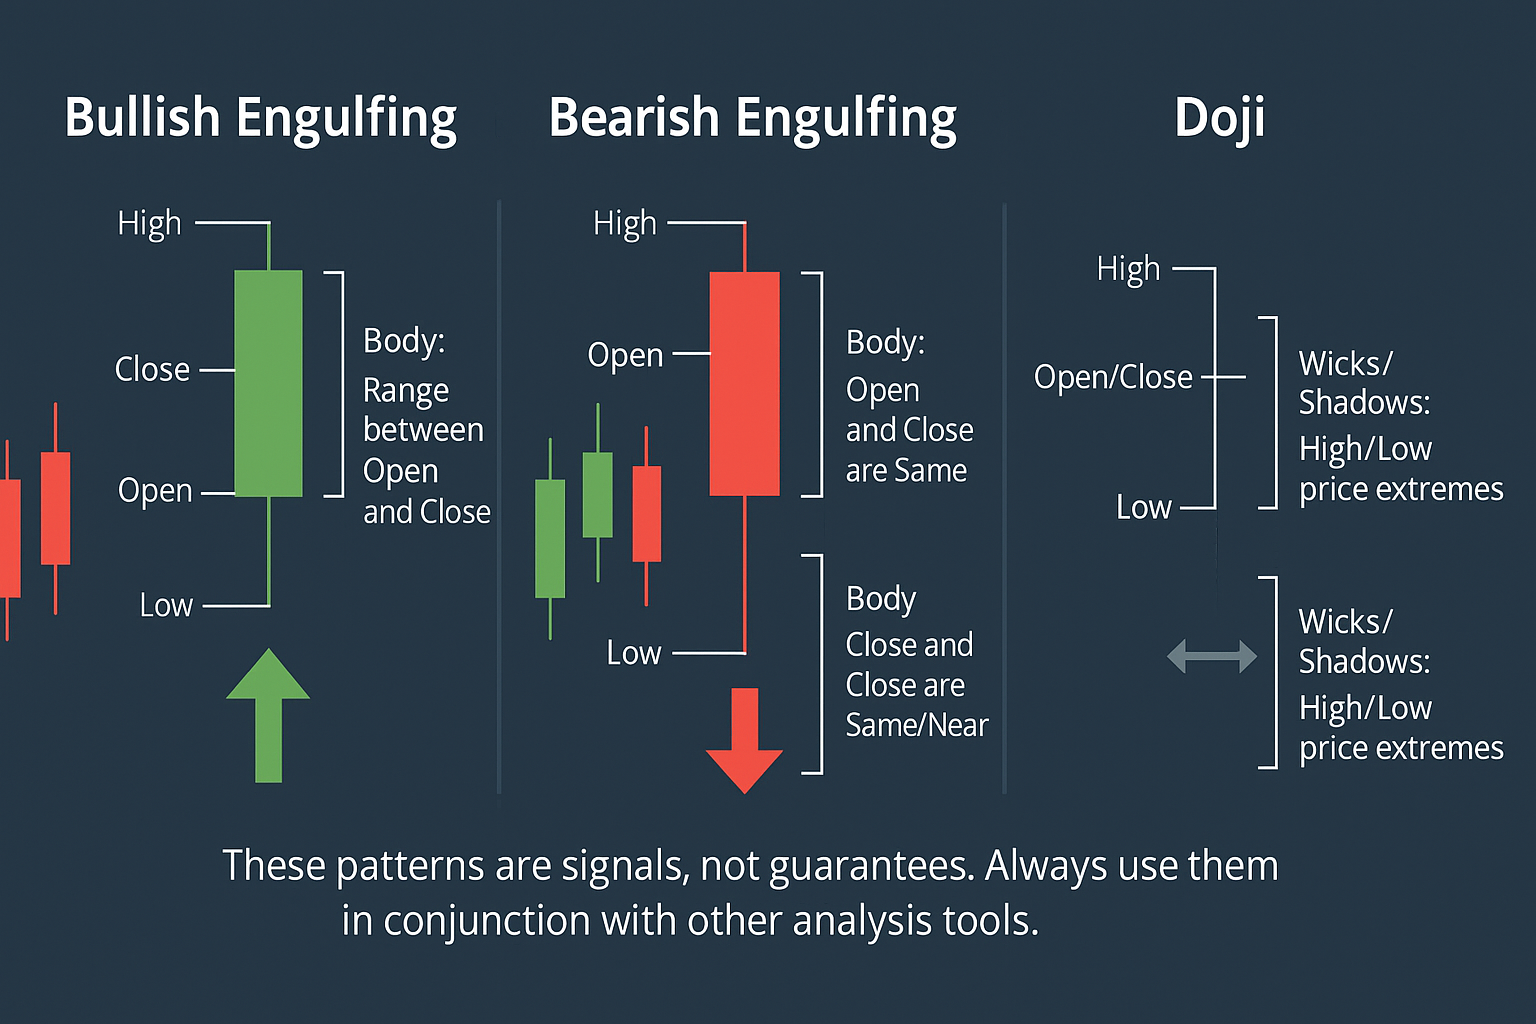
- Bullish Engulfing: A large bullish candle completely engulfs the previous bearish candle, indicating strong buying pressure.
- Bearish Engulfing: A large bearish candle completely engulfs the previous bullish candle, indicating strong selling pressure.
- Doji: A candle with a very small body, indicating indecision in the market (open and close prices are very similar).
- Hammer / Hanging Man: Small body with a long lower wick (hammer, bullish reversal) or long upper wick (hanging man, bearish reversal).
These patterns provide clues about potential reversals or continuations, but they should always be interpreted within the broader context of the chart.
By learning to read candlesticks, you begin to understand the "story" the market is telling through price action, which is a fundamental skill for any trader.
3. Support and Resistance Basics
Support and Resistance are among the most fundamental and crucial concepts in technical analysis. They represent price levels on a chart where the market has historically shown a tendency to pause or reverse. Understanding these zones helps traders identify potential entry and exit points, and gauge the strength of price movements.
Understanding Support Levels
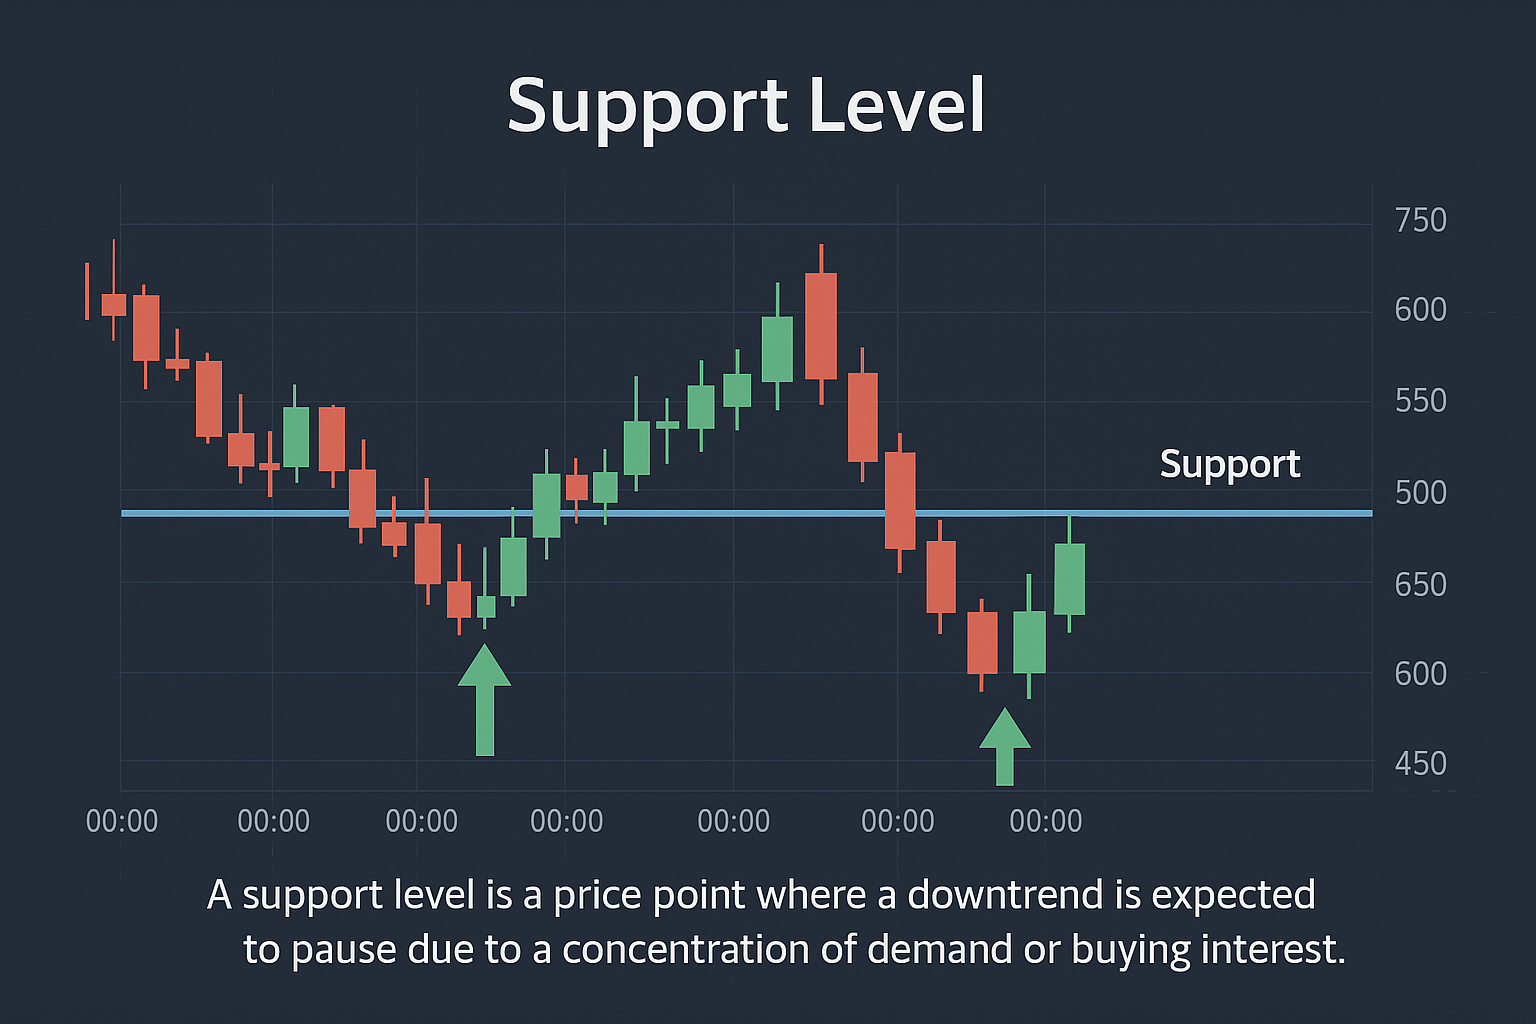
A **Support level** is a price point on a chart where, historically, the price has struggled to fall below. It acts as a "floor," where buying interest tends to overcome selling pressure, causing the price to bounce back up. Think of it as a demand zone where buyers are eager to step in.
- How to Identify: Look for areas where price has repeatedly stopped falling and reversed upwards.
- Psychology: Traders remember these levels and are inclined to buy when price approaches them.
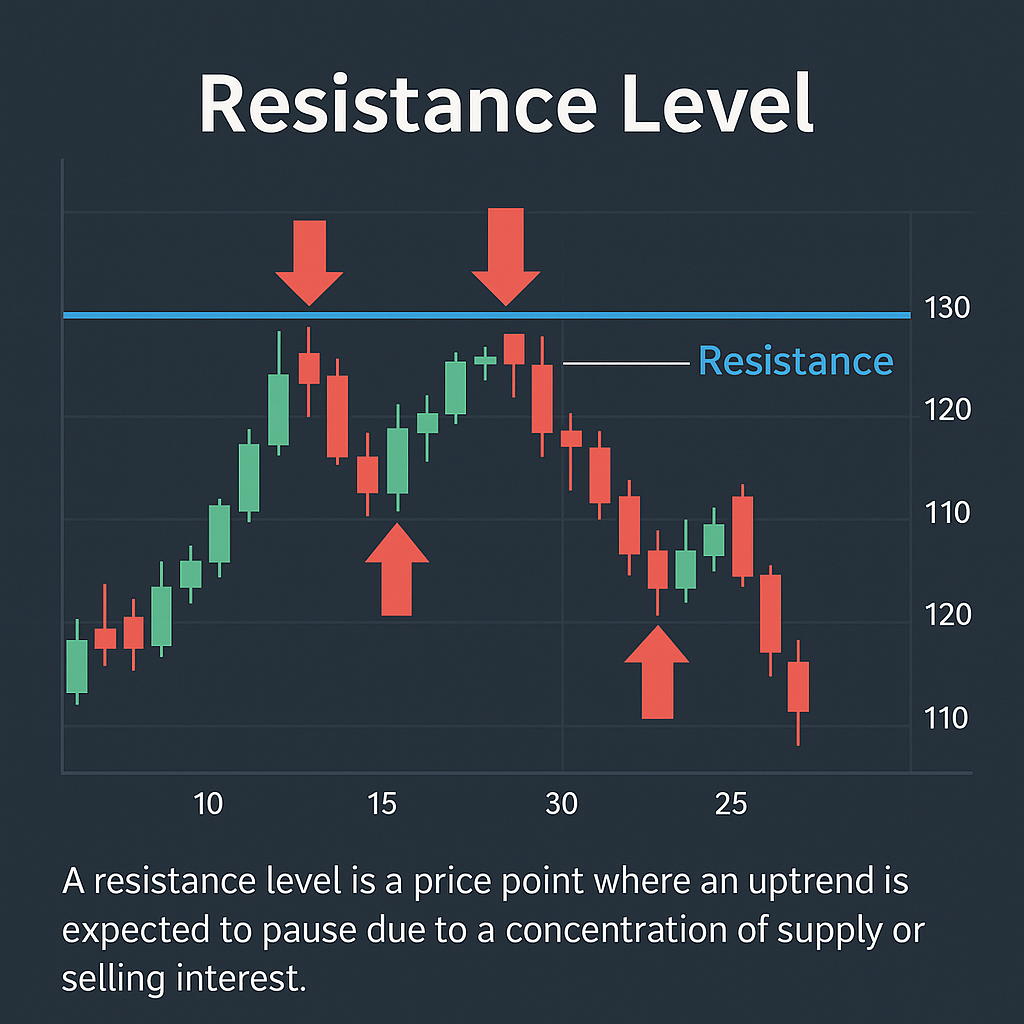
Understanding Resistance Levels
A **Resistance level** is the opposite of support. It's a price point where, historically, the price has struggled to rise above. It acts as a "ceiling," where selling pressure tends to overcome buying interest, causing the price to move back down. This is a supply zone where sellers are likely to become active.
- How to Identify: Look for areas where price has repeatedly stopped rising and reversed downwards.
- Psychology: Traders remember these levels and are inclined to sell when price approaches them.
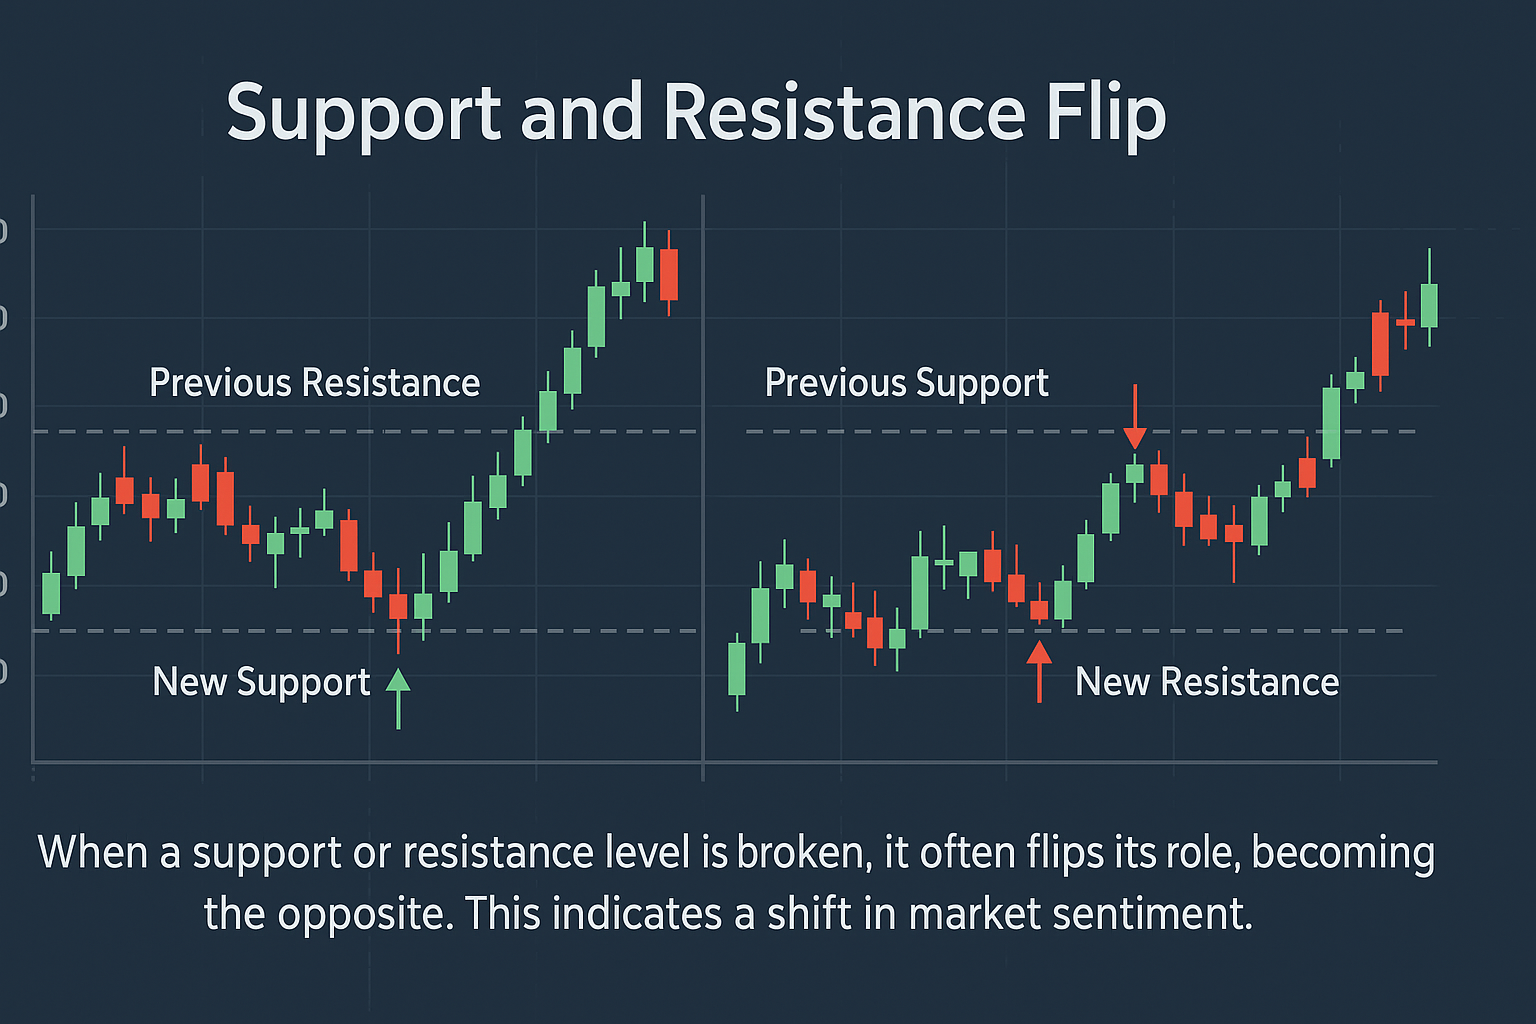
Support & Resistance Transformation (Flip)
A key concept is that once a strong support or resistance level is decisively broken, it often "flips" its role. A broken resistance level can become new support, and a broken support level can become new resistance. This is called the "flip principle" or "role reversal."
Imagine price struggling to break above a resistance level. If it finally breaks through with strong momentum, that former resistance often acts as a new support when price pulls back to it. This is a powerful setup!
Support and Resistance levels are not exact lines, but rather zones. They provide a foundational understanding of market structure and are a critical tool for manual traders.
4. Introduction to Technical Indicators
Technical indicators are mathematical calculations based on historical price, volume, or open interest data. Traders use them to gain additional insights into market conditions, confirm trends, identify potential reversals, or gauge momentum. This module will introduce you to the basic types of indicators and how they are commonly used.
Types of Technical Indicators
Technical indicators can broadly be categorized into a few main types:
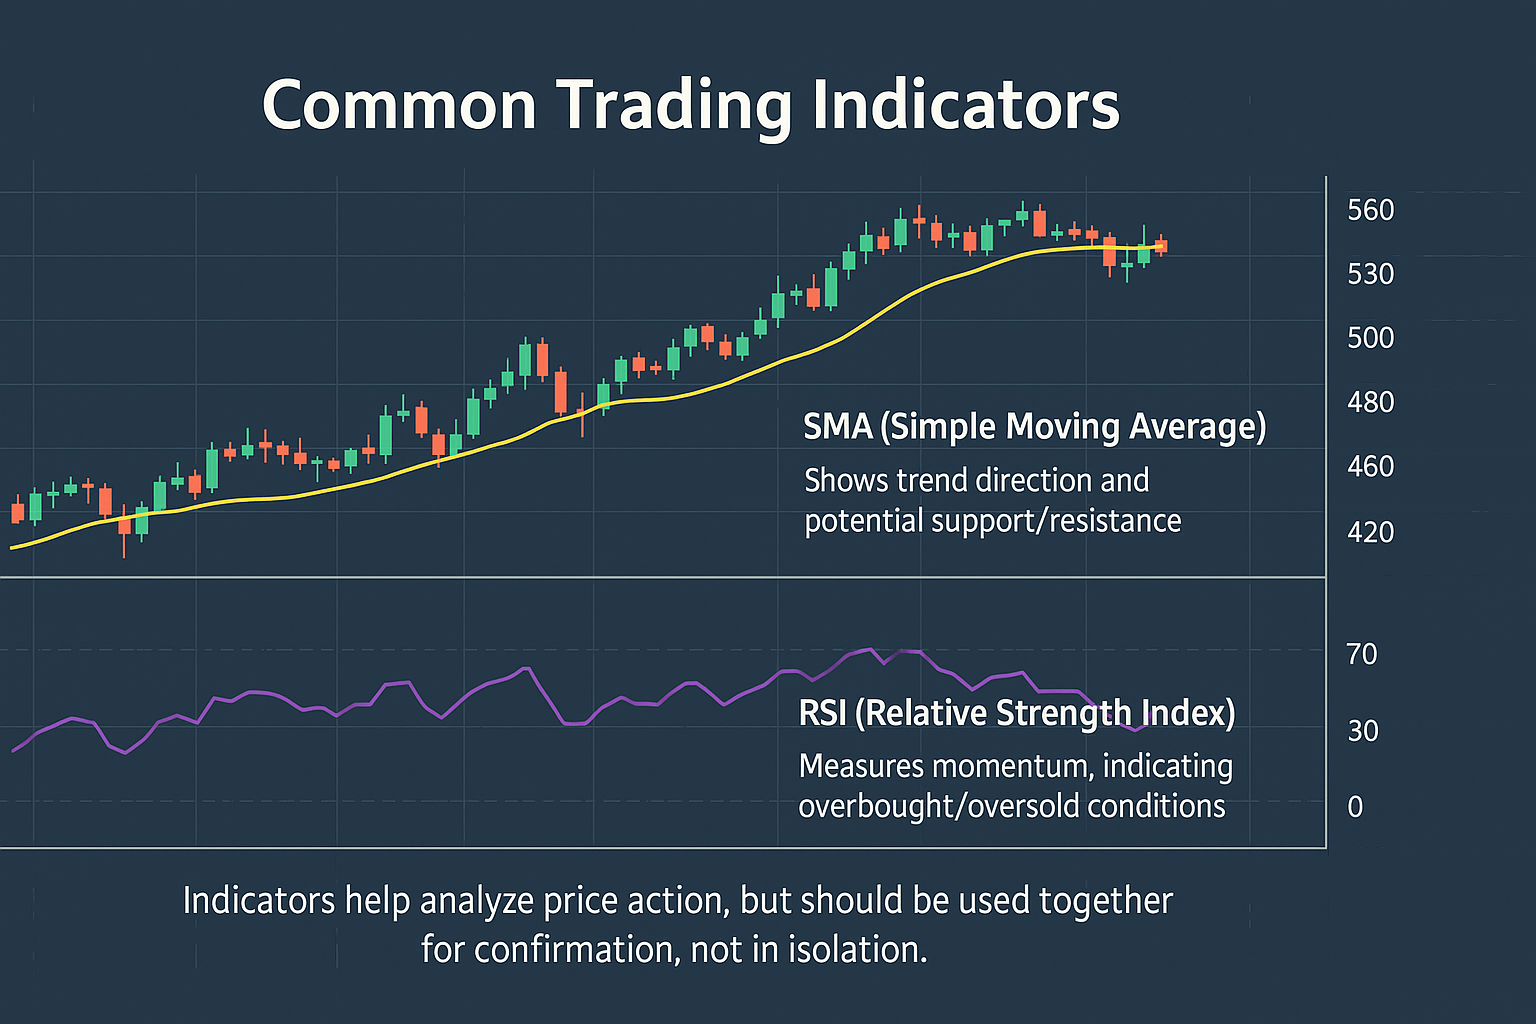
- Trend-Following Indicators: These indicators help identify the direction and strength of a market trend. They are lagging indicators, meaning they follow the price action.
- Examples: Moving Averages (MA), Moving Average Convergence Divergence (MACD).
- Momentum Indicators: These indicators measure the speed of price movement. They can help identify overbought or oversold conditions and potential reversals.
- Examples: Relative Strength Index (RSI), Stochastic Oscillator.
- Volatility Indicators: These indicators measure the degree of price fluctuations. High volatility means prices are moving rapidly, while low volatility means prices are relatively stable.
- Examples: Bollinger Bands, Average True Range (ATR).
- Volume Indicators: These indicators analyze trading volume to confirm trends or identify divergences. (Less common in Forex as volume is decentralized).
How to Use Indicators (General Principles)
Indicators are tools to assist your analysis, not to be blindly followed as standalone signals. Here are some general principles for using them:
- Confirmation: Use indicators to confirm what you see in price action (e.g., a bullish candlestick pattern confirmed by a momentum indicator moving higher).
- Divergence: Look for divergences between price and indicator (e.g., price making a higher high, but indicator making a lower high, suggesting a potential reversal).
- Confluence: The more indicators (and other analysis methods) that give you the same signal, the stronger the potential trade setup.
- Customization: Most indicators have parameters (e.g., period settings) that can be adjusted. These should be optimized for the specific asset and timeframe you are trading.
The UnifiedEA Expert Advisor uses a specific combination of optimized indicators for its strategy. This module gives you the foundational understanding before exploring those in depth in the Advanced Mastery Course.
It's important to understand two concepts:
- Lag: Most indicators use historical data, so they "lag" behind current price action. Don't expect them to predict the future perfectly.
- Repainting: Some indicators might "repaint" or change their historical values as new data comes in. Be cautious of such indicators if they are not clearly understood.
Always prioritize price action as the ultimate truth of the market, and use indicators as supporting evidence.
5. Stop Loss & Take Profit Explained
Proper risk management is arguably the most critical aspect of consistent profitability in trading. Without it, even the best trading strategy can lead to significant losses. Two fundamental tools in risk management are the Stop Loss (SL) and Take Profit (TP) orders. This module will explain what they are, why they are essential, and how to use them effectively.
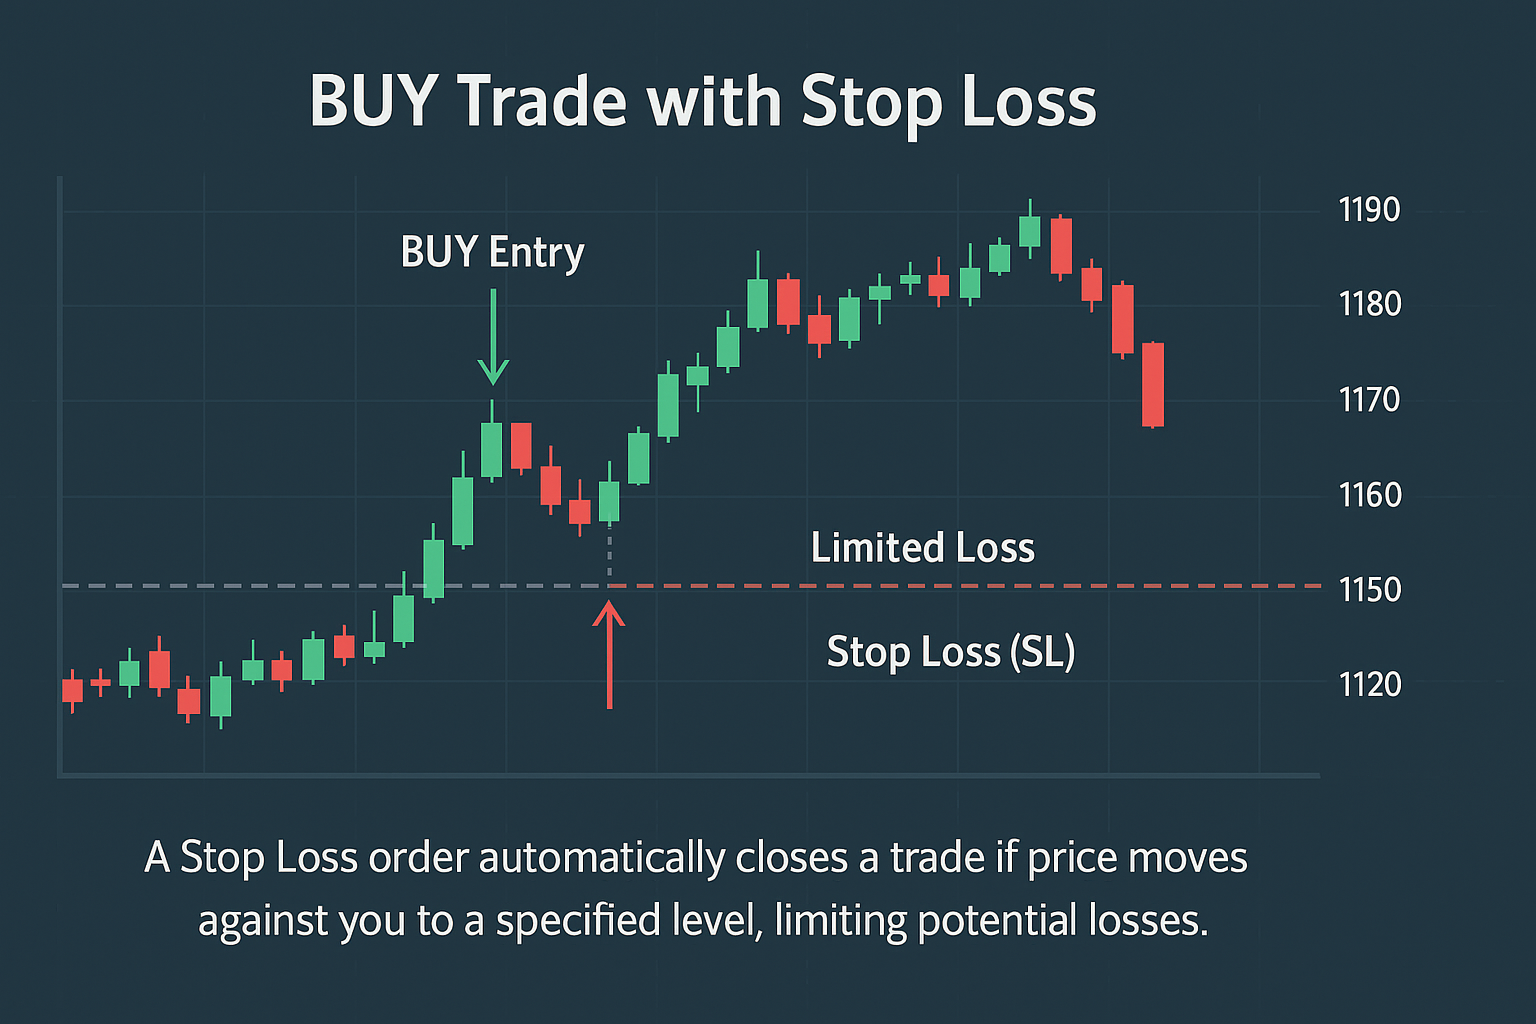
What is a Stop Loss (SL)?
A **Stop Loss** order is a pre-set instruction to your broker to close a trade automatically if the price moves against you to a certain level. It's designed to limit your potential loss on a trade. It is your ultimate protection against unexpected market movements and emotional decision-making.
- Purpose: To protect your capital by defining your maximum acceptable loss per trade.
- Placement: Strategically placed at a level where, if hit, your trading idea is invalidated. It should be based on technical analysis, not arbitrary fixed pips.
- Avoid Moving It: Once set, a stop loss should generally not be moved further away from the entry, as this increases risk. It can be moved closer (trailing stop) to lock in profits.
What is a Take Profit (TP)?
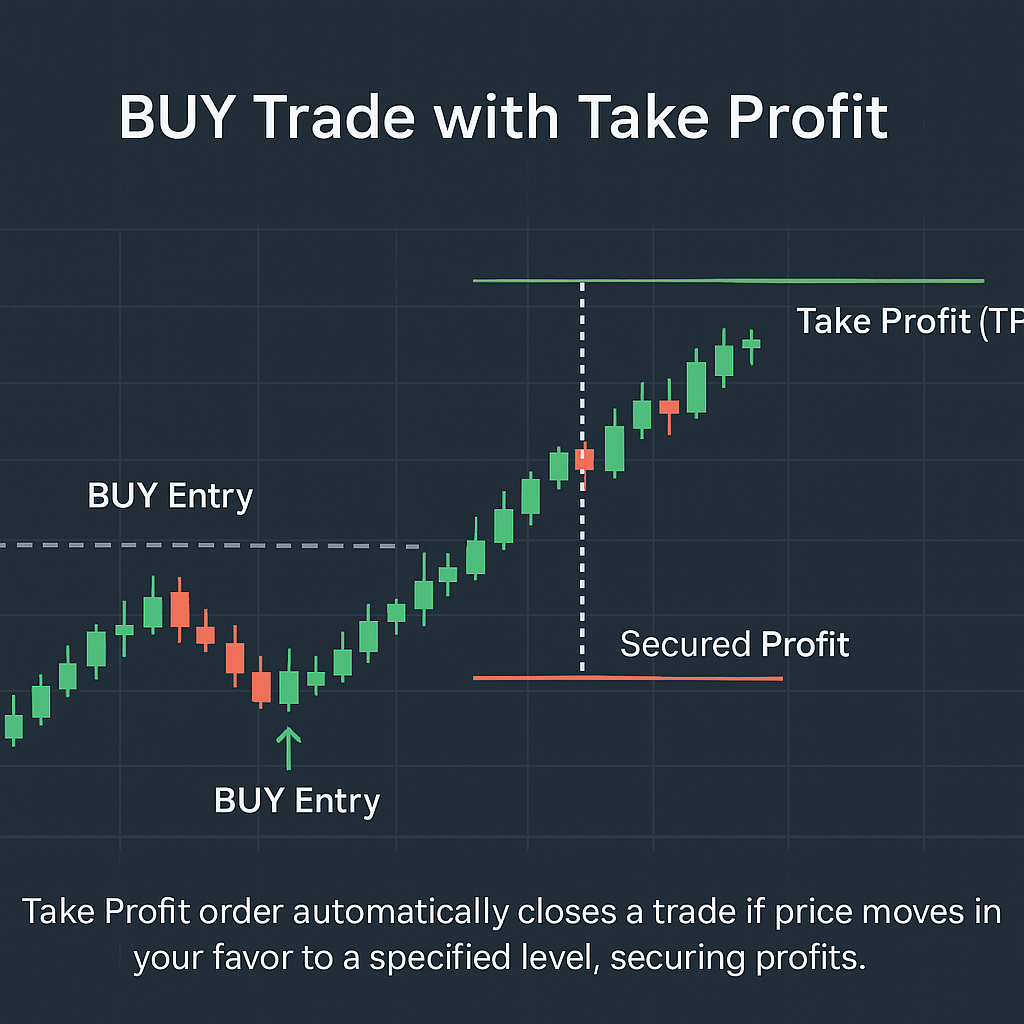
A **Take Profit** order is a pre-set instruction to your broker to close a trade automatically when the price reaches a certain profitable level. It's designed to lock in your gains without you having to manually monitor the trade.
- Purpose: To secure profits at a defined target, preventing greed from eroding gains during pullbacks.
- Placement: Strategically placed at a level where, based on your analysis, price is likely to reach before encountering significant resistance or reversal.
- Realistic Targets: Targets should be realistic and align with your trading strategy's expected move size.
Why SL and TP are Essential
Using Stop Loss and Take Profit orders for every trade is non-negotiable for responsible trading:
- Removes Emotion: Decisions are made beforehand, removing the emotional impulse to hold losing trades too long or close winning trades too early.
- Defines Risk: You know your maximum potential loss before entering a trade.
- Facilitates Risk/Reward Ratio: Allows you to calculate and maintain a favorable risk-to-reward ratio (covered in the next module).
- Automated Execution: Ensures trades are closed even if you are not actively monitoring the market (e.g., during sleep or work).
Always place your Stop Loss and Take Profit orders when you open a trade. Never trade without them.
Trading without a Stop Loss is akin to driving without brakes. It exposes your entire trading capital to unlimited risk. One large, unexpected market move can wipe out weeks or months of profits, or even your entire account. Always, always, always use a Stop Loss.
6. Position Sizing & Basic Risk/Reward
Position sizing and understanding risk/reward are two of the most powerful concepts in trading that often separate consistently profitable traders from those who struggle. This module will introduce you to these vital elements of risk management, ensuring you can manage your capital intelligently.
Position Sizing: Protecting Your Capital
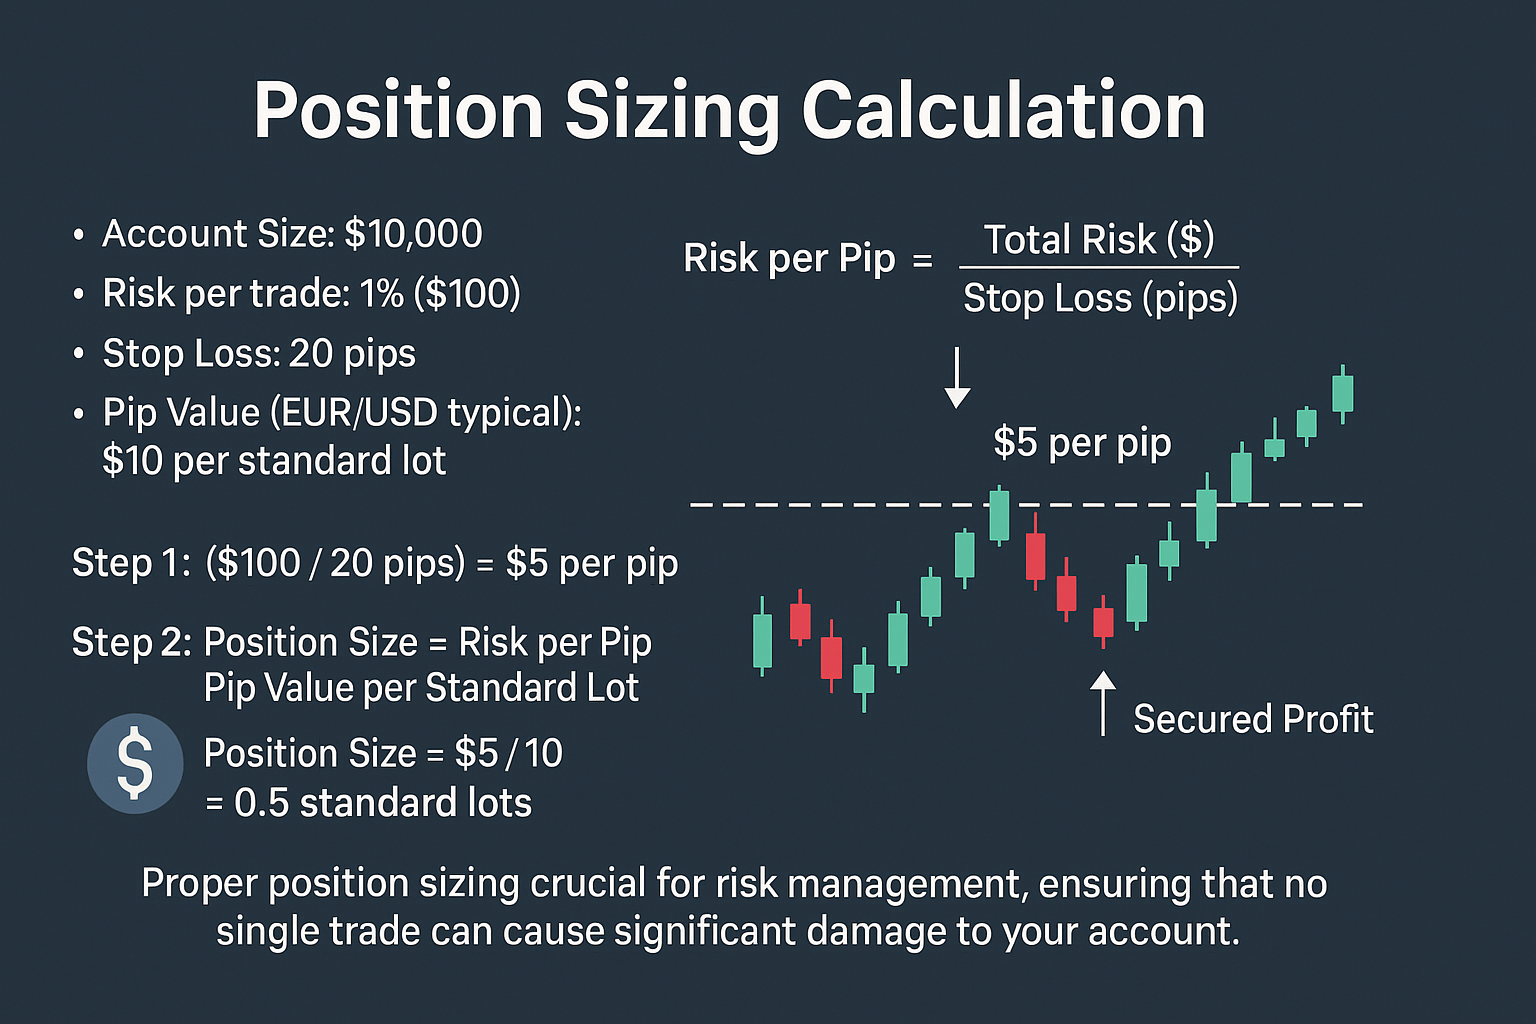
Position sizing refers to determining the appropriate lot size for each trade you take. It's not about how much you want to make, but how much you are willing to lose. The golden rule of position sizing is to **risk a small, fixed percentage of your account balance per trade**.
- The 1% Rule: A common and highly recommended rule is to risk no more than 1% to 2% of your total trading capital on any single trade. This means if you have a $1,000 account, you would risk $10-$20 per trade.
- Calculation: To calculate your lot size, you need:
- Your account balance.
- The percentage you're willing to risk (e.g., 1%).
- The distance of your Stop Loss (in pips) for that specific trade.
- The pip value of the currency pair you're trading.
Risk/Reward Ratio: Trading with an Edge
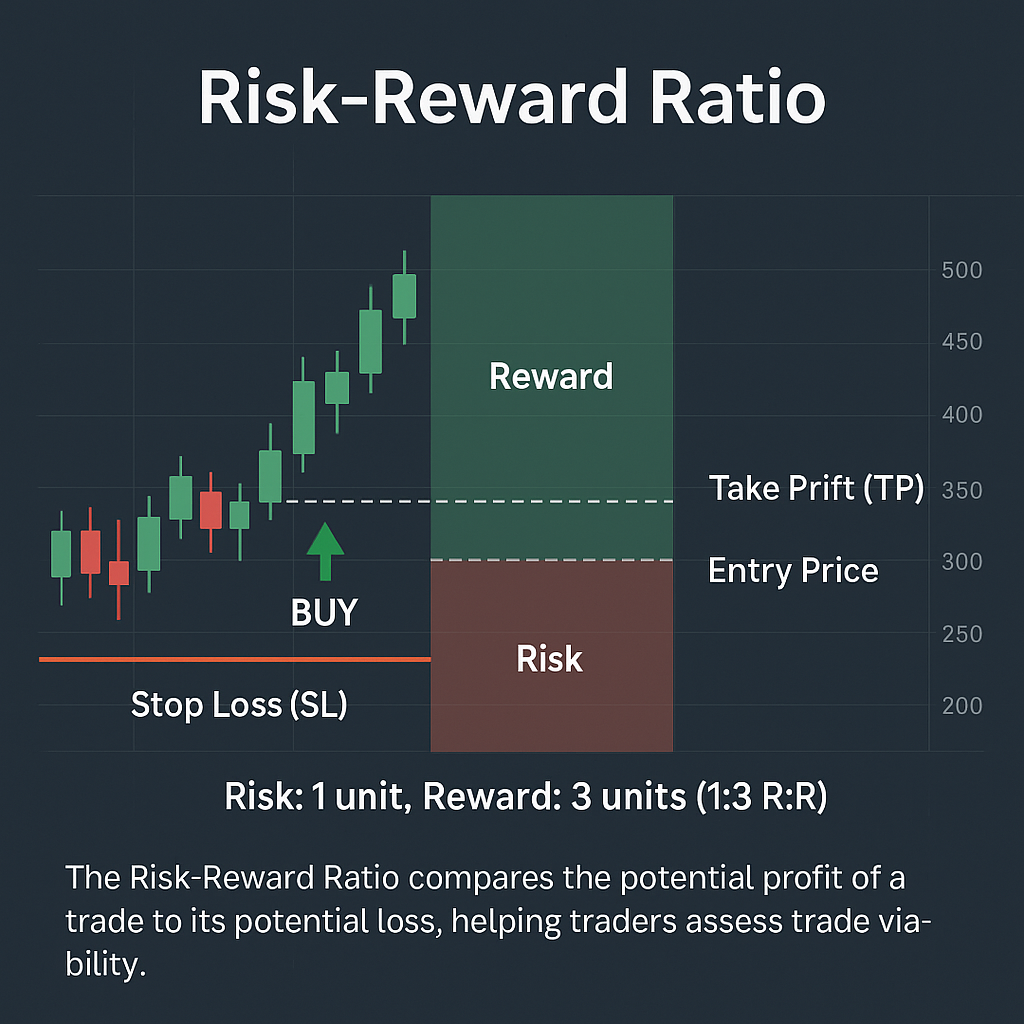
The **Risk/Reward (R:R) Ratio** measures the potential profit you stand to gain for every unit of risk you take on a trade. It's calculated by dividing your potential Take Profit distance (in pips or dollars) by your Stop Loss distance (in pips or dollars).
- Example: If your Stop Loss is 20 pips and your Take Profit is 60 pips, your R:R is 60/20 = 3, or 1:3.
- Why it Matters: A favorable R:R ratio means your winning trades are larger than your losing trades. This allows you to be profitable even if your win rate is less than 50%.
Always aim for trades with a minimum R:R of 1:2 or higher. The UnifiedEA strategy is designed with a very favorable R:R to ensure long-term profitability. By consistently applying sensible position sizing and targeting positive risk/reward, you build a robust and sustainable trading approach.
Many new traders focus solely on win rate. However, a high win rate with poor risk/reward can still lead to losing money. Conversely, a lower win rate with a strong risk/reward can be very profitable:
- If you win 50% of your trades with a 1:1 R:R, you break even (ignoring commissions).
- If you win only 40% of your trades but with a 1:2 R:R, you are profitable! (4 wins x 2 units = 8 units profit; 6 losses x 1 unit = 6 units loss. Net profit = 2 units).
Focus on consistent application of your strategy with a good risk/reward, not just how many times you win.